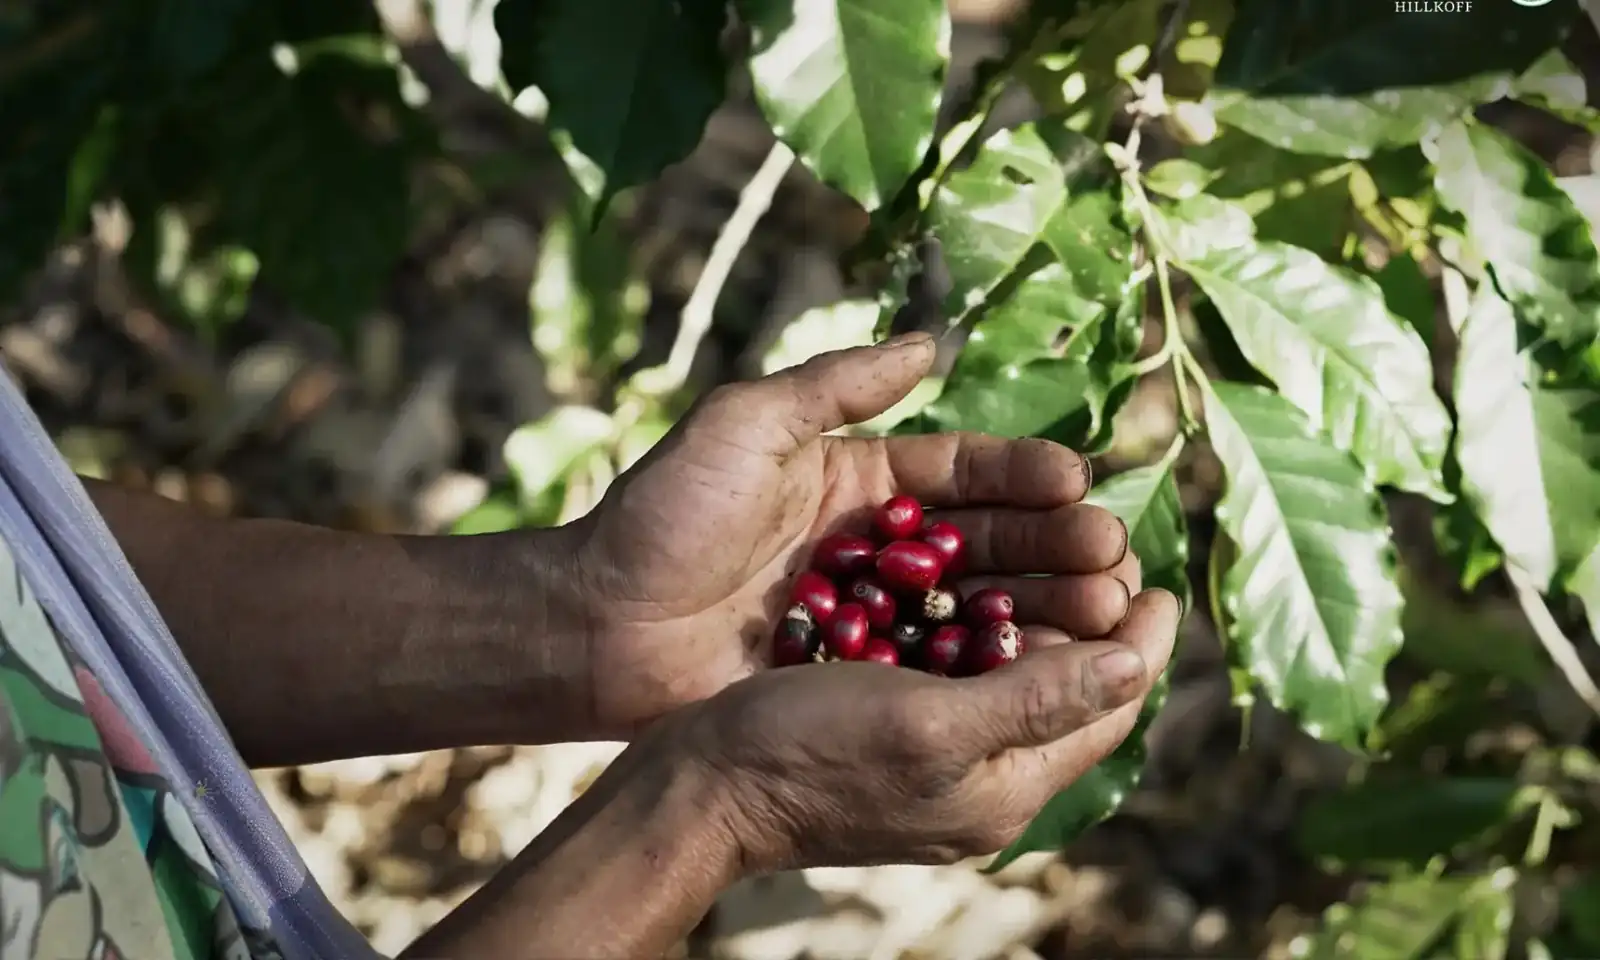
Plots in the network
1,047
Data source: public_origin_totals
Loading

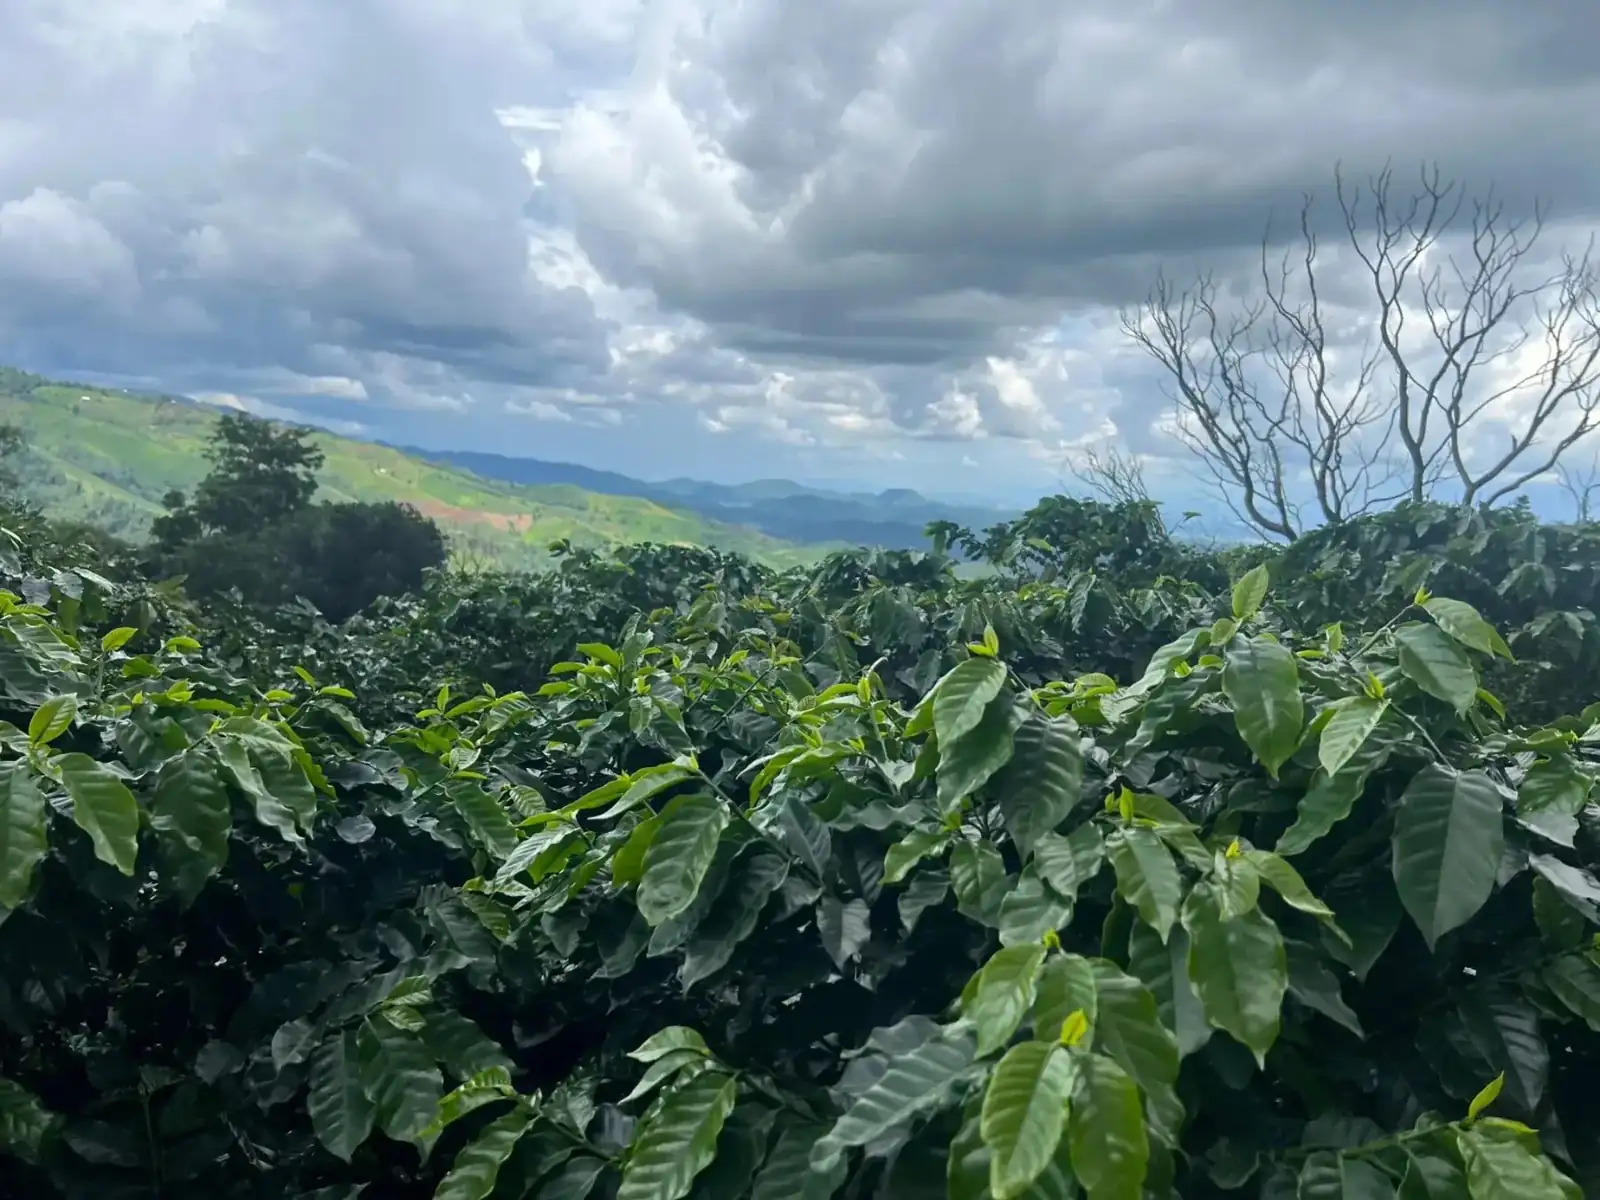
This page gathers the data evidence behind responsible sourcing: production standards, EUDR-aligned readiness, watershed context, and overview-level hotspot monitoring.
Plots in the network
1,047
Data source: public_origin_totals
Unique farmers
955
Data source: public_origin_totals
Provinces covered
5
Kanchanaburi · Tak · Chiang Rai · Chiang Mai · Mae Hong Son
Data source: public_origin_totals
Community-level summary areas
80
Spatial summary points
Data source: public_origin_stats
Hillkoff works with farmers in Thailand's highlands on the principle of traceability from plot to product. Plot, farmer, and certification data are held in the same system used to manage risk internally, so the figures published here reference the same source as internal company reporting.
Plots in the network operate under GAP guidelines, and some are part of the organic system. Each plot's production-type data is recorded and published in the origin database so partners can verify the proportion and spread of each standard for themselves.
Publishing real, authorised plot coordinates is a key part of preparing for the EUDR regulation, which requires production plots to be geolocated. Hillkoff publishes coordinates at the level the data owner has authorised, and keeps other personal data in internal systems.
Most coffee plots sit within upstream watershed areas, so watershed-group data is recorded alongside plot location — letting environmental-impact assessment consider area context, not just individual plot boundaries.
Uses NASA FIRMS satellite heat-detection data compared against plot locations within a 250-metre radius. This result is an overview-level spatial comparison, not confirmation that a fire occurred on any specific plot.
Plots with no hotspot within 250 m
1,008
96.3% of assessed plots
Data source: public_hotspot_summary
Plots flagged for further review
39
Enters our internal field-verification process
Data source: public_hotspot_summary
Observation days in the summary period
190
2026-01-01 to 2026-07-30
Data source: NASA FIRMS
Total detections in the summary period
385,757
Covers the full summary area, not limited to coffee plots
Data source: NASA FIRMS
See the spatial distribution and detailed filters on the origin database
The data on this page is published at overview and area level only. No individual hotspot event is disclosed as linked to a specific plot or farmer. Contact details, personal documents, individual yields and purchase values are not included on this public website.
From measuring our organisational carbon footprint and reusing coffee by-products to regenerative farming that cares for soil and farmer income.
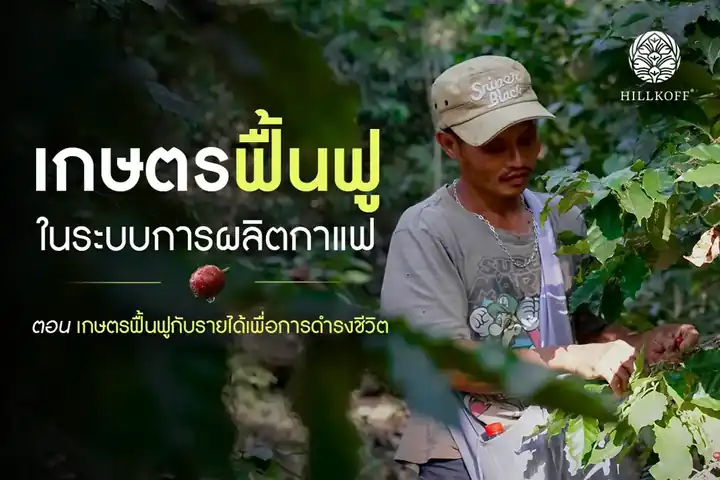
Sustainability ·
How regenerative farming can reduce income risk for smallholder highland coffee farmers.
Read the article
Sustainability ·
Building on ten years of work to cut greenhouse gas emissions.
Read the article
Sustainability ·
Cherry skins, parchment and spent grounds go back into farming instead of landfill.
Read the article